I wanted a simple stock portfolio monitoring tool. I failed to find a simple and free app, but happily discovered that Google Sheets does what I need perfectly!
My requirements are to track my stock portfolio (stock, quantity, purchase price and date), calculate potential profit based on current market prices, and display a chart of price movement. The Stocks notification center widget does not do this.
I tried a couple from the Mac App Store like Stock+ and StockSpy but either they were too complex (i.e. I was too dumb), or they simply did not do what I wanted.
I know that many brokers provide apps or portals with these features, as do on-line services like Bloomberg, Morningstar and The Motley Fool.
Plus there are Open Source alternatives like JStock and free apps like Ticker (this last one is super buggy, don't bother with it)
But what I finally settled on was using Google Sheets! It's simple and flexible, plus works across all my devices (Windows, Mac, iPhone/iPad, Android tablet), even off-line! (Though the market data will obviously not be up-to-date)
Here's how to create a watch list as above:
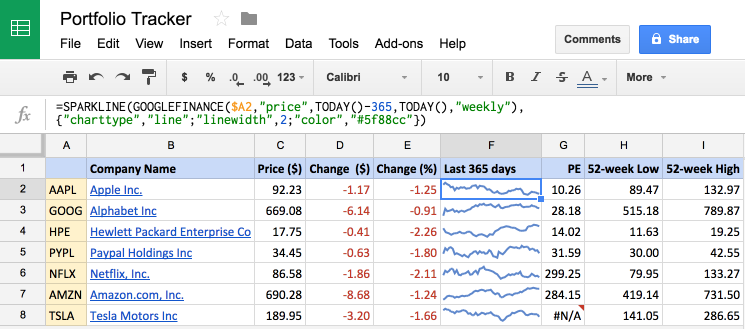
- The first column, Column A, is the Stock Ticker Symbol (is that what it's called?) - enter this manually. In this example, the cell is
A2. - Column B is the Company Name, hyperlinked to the Google Finance page using the formula
=HYPERLINK("https://www.google.com/finance?q=" & $A2, GOOGLEFINANCE($A2,"name")) - Column C,
=GOOGLEFINANCE($A2)will retrieve the near real-time price quote (up to 20 minutes delayed). - The next few columns (except F) are just variations to fetch other data, i.e.
=GOOGLEFINANCE($A2,"changepct")to get the percentage change in price since the previous trading day's close.=GOOGLEFINANCE($A2,"pe")for the price/earnings ratio.=GOOGLEFINANCE($A2,"change")for the price change since the previous trading day's close.=GOOGLEFINANCE($A2,"low52")and=GOOGLEFINANCE($A2,"high52")for 52-week low and high price respectively.
- But the Last 365 days sparkline price chart in Column F is a thing of beauty and easy to achieve with just
=SPARKLINE(GOOGLEFINANCE($A2,"price",TODAY()-365,TODAY(),"weekly"),{"charttype","line";"linewidth",2;"color","#5f88cc"})
So simple! So beautiful!
Hack warning! Google's documentation does not list "name" as a valid input to the GOOGLEFINANCE() function, but it works for me!
From here you can figure out how to create a portfolio monitor with profit/loss charts like I did. In that spreadsheet however, I changed the sparkline to a more granular 90 day chart based on daily price data (all this should be entered on one line):
=SPARKLINE(
 GOOGLEFINANCE($A2,"price",TODAY()-90,TODAY(),"DAILY"),
 {"charttype","line";"linewidth",2;"color","#5f88cc"})
Imagine, I used to do this in Excel with a ton of VBA.