I have been having issues with my Intel Core i7 MacBook Pro - as the notebook heats up, the LCD display starts to die. Initially the display would glitch - black bars or lines of dead pixels would appear at the bottom of the display,. Then these dead portions start to “jump” causing the display to flicker. The glitches progressively affect a larger and larger portion of display, until the display gives up and just just goes blank! Perhaps the flexgate design flaw with the ribbon cable between the motherboard and display...
For me, high temperatures trigger the issue - high-energy processes (Docker, VirtualBox, Chrome, etc.), the Radeon GPU (external montiors, web conference, etc.) and charging the battery all contribute. There is no solution... but now I try to keep an eye on the system temperature, if nothing else, just for an early warning of impending failure....
Method 1: macOS powermetrics
The built-in command is sudo powermetrics -s smc, but that prompts for the sudo password, and is not very user friendly. Use sudo powermetrics -s smc -n1 -i1 to only run once and skip the time delay.
**** SMC sensors ****

CPU Thermal level: 56
GPU Thermal level: 6
IO Thermal level: 6
Fan: 2472 rpm
CPU die temperature: 74.12 C
GPU die temperature: 35.00 C
CPU Plimit: 0.00
GPU Plimit (Int): 0.00
GPU2 Plimit (Ext1): 0.00
Number of prochots: 0
Method 2: Intel Power Gadget
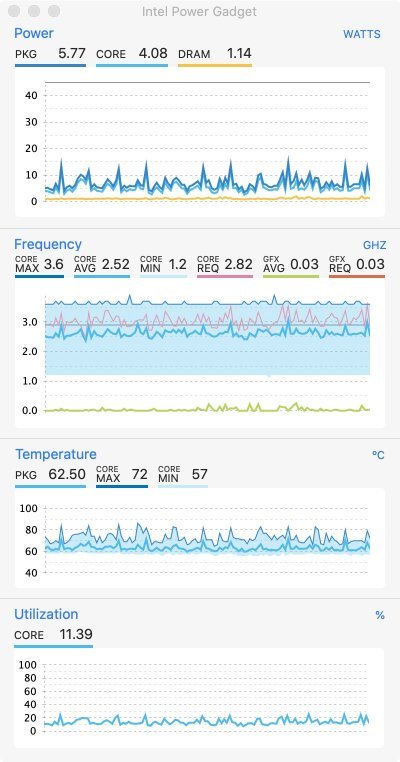
I also tried the Intel® Power Gadget.
The numbers under PKG do differ from the previous CPU die temperature, and admitted I don’t know what each is measuring.
Method 3: bottom
However, I realized that bottom (a top-like tool written in Rust) has a better view with additional information like CPU utilization and processes. I like btm because it takes so little RAM compared to Intel Power Gadget which seems to require 124MB.
The PECI CPU value seems to more closely match the PKG output from the Intel Power Gadget.
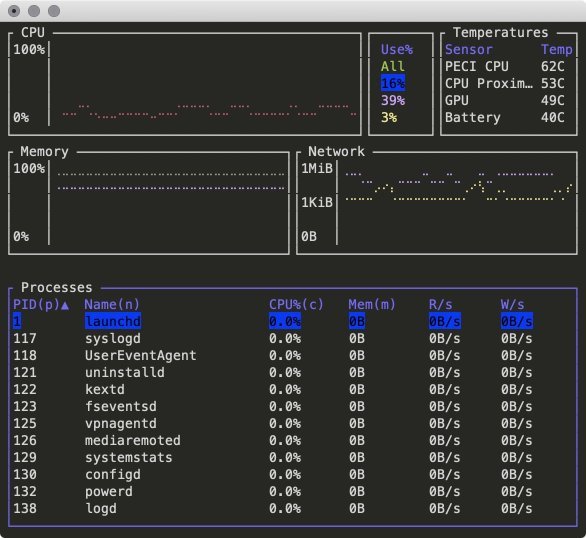
The screenshot above is a slightly customized theme, via a $HOME/Library/Application Support/bottom/bottom.toml configuration file that looks like this:
[flags]
battery=true
current_usage=true
default_widget_type="proc"
hide_table_gap=true
hide_time=true
mem_as_value=true
rate=2000
[colors]
swap_color="darkgray"
[[row]]
 ratio=1
 [[row.child]]
  ratio=3
  type="cpu"
 [[row.child]]
  ratio=1
  type="temp"
[[row]]
 ratio=1
 [[row.child]]
  type="mem"
 [[row.child]]
  type="net"
[[row]]
 ratio=2
 [[row.child]]
  type="proc"